Visible Metrics
The Numbers Behind the Trades
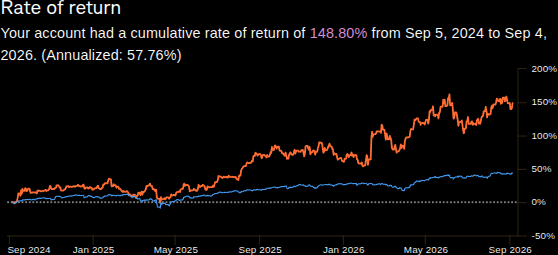
- Cash-Flow Adjusted Return
-
148.80%
- SPY Return
-
39.98%
- Excess Return vs. SPY
-
108.82 pp
- Alpha vs. SPY
-
50.57%
- Beta vs. SPY
-
0.40
- Up Capture
-
97.62%
- Down Capture
-
50.13%
- SPY Correlation
-
0.16
- Max Drawdown
-
-27.47%
- Drawdown Trough
-
Apr 9, 2025
- Daily Volatility
-
2.59%
- Downside Deviation
-
1.65%
- Ulcer Index
-
9.57%
- Recovery Factor
-
5.42
- Sharpe Ratio
-
1.32
- Sortino Ratio
-
2.07
- Calmar Ratio
-
2.11
- Trading Days
-
502
- Closed Lots
-
558
- Non-Loss Lots
-
324
- Losing Lots
-
234
- Win Rate
-
58.06%
- Average Gain
-
5.56%
- Average Loss
-
-5.57%
- Profit Factor
-
1.36
- Payoff Ratio
-
0.98
- Expectancy
-
0.89%
- Best Closed Lot
-
75.67%
- Worst Closed Lot
-
-23.25%
- Average Hold
-
6.2 days
- Longest Gain Streak
-
12
- Longest Loss Streak
-
8
Trade statistics use Schwab realized closed lots. Daily risk statistics use the supplied account balances on the fixed NYSE session calendar and cash-flow adjustments from the transaction ledger.
SPY tracks the S&P 500. Benchmark metrics use the same 502 sessions, from September 5, 2024 through September 4, 2026. SPY uses the stored closing-price series. Dividend adjustment is not independently verified; these results are not labeled as dividend-reinvested total return.
Excess return is the difference in percentage points. Beta and correlation compare daily returns. Alpha is ANNIE's annualized return minus beta times SPY's annualized return, using 252 sessions per year and the shared daily calculator. Capture ratios compare summed daily returns on positive or negative SPY days.